Understanding average speed vs instantaneous speed is essential if you want to interpret motion correctly in physics and real-world driving situations. You often hear the word speed used casually, yet in science it carries precise meaning that affects calculations, graphs, and decision-making. When you grasp the difference between these two ideas, you gain control over how you analyze motion, performance, and travel data.
Speed influences everything from athletic performance to highway safety and engineering design. If you confuse average speed with instantaneous speed, you may misinterpret data or draw inaccurate conclusions about motion.
This article gives you a clear, accurate, and practical breakdown so you can apply both concepts confidently.
What Average Speed Really Means
Average speed measures how much total distance you travel divided by the total time it takes. You calculate it using the formula: average speed equals total distance divided by total time. This value represents an overall summary of motion rather than what happens at any specific second.
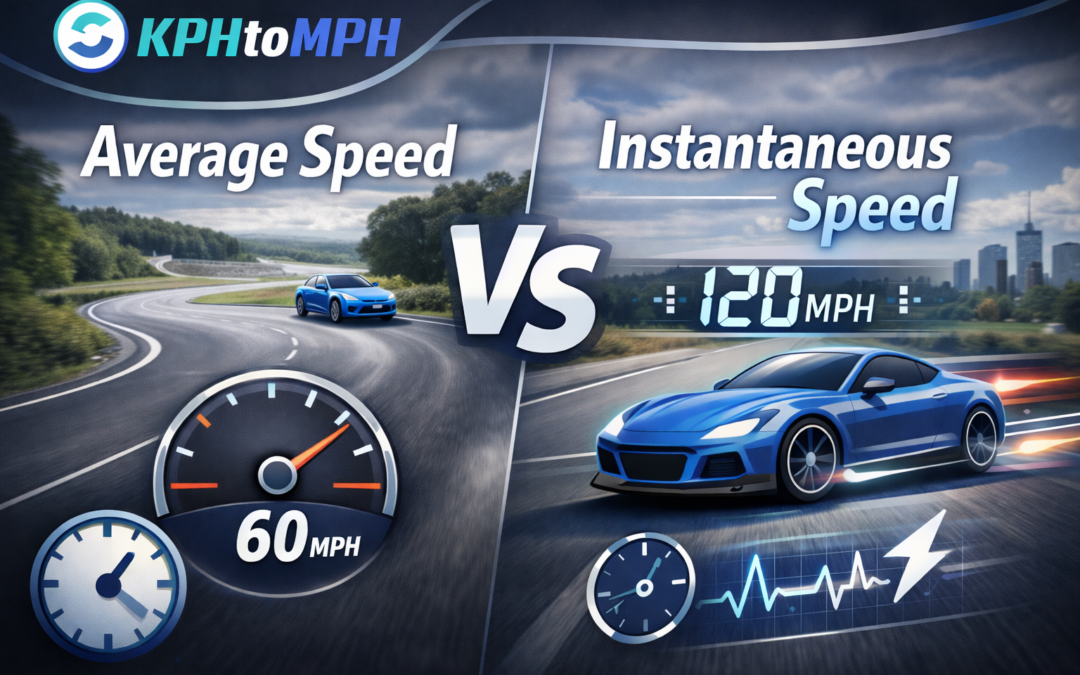
If you drive 120 miles in two hours, your average speed is 60 miles per hour even if your speedometer rarely shows exactly 60. You may stop at traffic lights, accelerate to 75 mph, and slow down to 40 mph, yet the overall ratio defines your average. This explains why average speed hides the fluctuations that occur during the journey.
Engineers, traffic analysts, and coaches rely on average speed because it gives a clean numerical representation of total performance. It helps you compare trips, races, or processes in a consistent way. However, it does not describe what is happening at a precise moment.
What Instantaneous Speed Actually Represents
Instantaneous speed tells you how fast you are moving at a specific moment in time. When you glance at your car’s speedometer, you see your instantaneous speed rather than your trip average. That reading changes continuously as you accelerate or brake.
In physics, instantaneous speed becomes especially important when motion is not constant. It allows you to analyze motion in fine detail rather than smoothing it into a single number. This concept becomes clearer when you examine motion graphs and slopes.
On a position-versus-time graph, instantaneous velocity equals the slope of the tangent line at a specific point. A steeper slope indicates a greater instantaneous speed, while a flatter slope indicates slower motion. This graphical interpretation helps you connect mathematics directly to physical movement.
The Core Mathematical Difference
The formula for average speed is straightforward and uses total distance and total elapsed time. Instantaneous speed, in contrast, emerges from examining an extremely small time interval approaching zero. In calculus terms, it represents the limit of the average speed as the time interval shrinks.
When you measure shorter and shorter time segments, the calculated average speed begins to resemble the instantaneous value. This relationship shows that instantaneous speed is not a separate idea but an extension of the average concept applied at a microscopic scale. The precision increases as the time interval decreases.
This mathematical distinction matters because real-world motion rarely stays constant. Vehicles, runners, and machines constantly adjust their speed in response to conditions. Understanding the limit process strengthens your conceptual clarity and analytical accuracy.
Real-World Driving Examples
Imagine you travel five miles in twelve minutes. Dividing five miles by 0.2 hours gives you an average speed of 25 miles per hour. Yet during that time, you might have reached 50 mph and also stopped at intersections.
Your dashboard speedometer displays your instantaneous speed, which may spike or drop within seconds. This constant fluctuation shows why instantaneous speed provides a moment-by-moment snapshot. Average speed, meanwhile, summarizes the entire trip.
If you compare units between countries, the distinction remains the same even though the numbers differ. The explanation in km per hour vs mph clarifies how measurement systems affect speed interpretation without changing the underlying physics. Unit conversion changes representation, not the physical concept.
Graphical Interpretation of Motion
Graphs reveal the relationship between time and motion in a visually powerful way. On a straight-line position-time graph, constant slope indicates constant velocity and therefore constant instantaneous speed. In this special case, average and instantaneous speeds are equal.
When the graph curves, the slope changes from point to point. The tangent line at a single point gives the instantaneous velocity, while the slope of a line connecting two points gives average velocity over that interval. This visual difference deepens your conceptual understanding.
If the slope becomes negative, velocity becomes negative as well, indicating motion in the opposite direction. Speed remains positive because it reflects magnitude only, not direction. This distinction separates speed from velocity clearly and accurately.
Speed Versus Velocity Clarified
Speed measures how fast you move regardless of direction. Velocity includes both magnitude and direction, making it a vector quantity. Average velocity uses displacement divided by total time rather than total distance.
If you walk three miles north and then three miles south, your total distance is six miles but your displacement is zero. Your average speed is positive, yet your average velocity equals zero because your starting and ending positions match. This example shows why direction matters in velocity calculations.
Instantaneous velocity follows the same logic as instantaneous speed but includes direction. The slope of a position-time graph can be positive or negative depending on direction of motion. Speed simply takes the absolute value of velocity.
Why Instantaneous Speed Matters in Safety
Instantaneous speed determines how quickly you approach obstacles and how much stopping distance you need. According to the National Highway Traffic Safety Administration, speeding contributes to thousands of traffic fatalities each year in the United States. Your real-time speed directly affects reaction time and braking distance.
Wind conditions also influence how safe your instantaneous speed truly is. Strong gusts can destabilize vehicles, especially at highway speeds. Understanding factors such as what wind speed is dangerous for driving km h helps you connect physics principles to practical safety decisions.
When you monitor instantaneous speed instead of relying on trip averages, you make better real-time choices. Safety depends on the speed you are traveling now, not the speed you averaged earlier. This awareness enhances responsible driving.
Comparing Human and Extreme Speeds
Human walking speed averages about 5 km per hour, which equals roughly 3.1 mph. Elite sprinters, however, reach instantaneous speeds far beyond that during competition. These comparisons show how averages and peak speeds differ dramatically.
When you examine Usain Bolt top speed km h, you see how instantaneous speed can reach over 44 km per hour during peak performance. His average speed over 100 meters remains lower because acceleration and deceleration occur at the start and finish. This difference illustrates the same principle seen in vehicle motion.
Understanding these contrasts helps you interpret sports statistics accurately. Average race speed does not equal the fastest moment achieved during the sprint. The peak instantaneous value often defines performance highlights.
Tools for Accurate Speed Conversion
Speed values often appear in different units depending on context. In the United States, miles per hour dominates highway signage, while many countries use kilometers per hour. Converting between these units ensures clarity and precision.
Using a reliable KPH to MPH converter allows you to switch between systems instantly without calculation errors. This tool supports accurate interpretation of data when reading international research or vehicle specifications. Clear unit conversion strengthens analytical confidence.
When you analyze average speed vs instantaneous speed, unit consistency becomes essential. Misinterpreting units can distort comparisons and conclusions. Precision in measurement supports precise reasoning.
Practical Applications in Engineering and Physics
Engineers design braking systems, road curves, and safety barriers using instantaneous speed data. They calculate forces based on real-time velocity because impact energy depends on the square of speed. A small increase in instantaneous speed can dramatically increase collision severity.
Scientists studying motion use sensors to measure speed over extremely small time intervals. These measurements approximate instantaneous speed in experimental settings. Advanced instruments reduce time intervals to fractions of a second for high accuracy.
Average speed still plays a crucial role in logistics, transportation planning, and performance benchmarking. Delivery companies track average speed to estimate arrival times and fuel efficiency. Each concept serves a specific purpose in applied physics.
Common Misconceptions You Should Avoid
Many people assume that average speed describes how fast they were driving at any random moment. This assumption leads to confusion, especially when legal or safety issues arise. Your ticket depends on instantaneous speed, not your trip average.
Another misconception is that instantaneous speed requires complicated mathematics in all cases. In reality, you observe it directly with instruments such as speedometers or digital sensors. The advanced math simply explains why the concept works.
You should also avoid confusing speed with velocity in multi-directional motion. Direction determines whether velocity becomes positive or negative. Clear terminology prevents analytical errors.
How to Master Both Concepts
To master average speed vs instantaneous speed, practice calculating both from real examples. Record a short trip, measure distance and time, and compute your average speed. Then observe your dashboard readings to compare moment-by-moment changes.
Next, sketch simple position-time graphs and draw tangent lines to approximate instantaneous velocity. This visual exercise strengthens your understanding of slopes and limits. Repetition builds conceptual confidence.
Finally, connect these principles to real-world data such as sports statistics, weather conditions, and vehicle performance. When you see speed reported, ask whether it represents an average or a momentary peak. That question sharpens your scientific reasoning.
Conclusion
When you clearly understand average speed vs instantaneous speed, you gain a deeper grasp of motion in both physics and daily life. Average speed summarizes an entire journey using total distance and total time, while instantaneous speed captures your exact rate of motion at a specific moment. Each concept answers a different question, and both remain essential for accurate analysis.
You use instantaneous speed for safety, engineering calculations, and real-time performance evaluation. You rely on average speed for benchmarking, planning, and comparing trips or events. By separating these ideas carefully and applying them correctly, you strengthen your analytical precision and make smarter, data-driven decisions.